

Basal Body Temperature Tracking: A Simple Guide to Understanding Your Cycle
Your body gives you daily signals about what’s happening hormonally.
Basal Body Temperature (BBT) is one of the simplest ways to track those changes.
It measures your body’s resting temperature first thing in the morning — before movement, food, or stimulation.
This temperature shifts in response to ovulation.
How BBT Reflects Hormones
Basal body temperature is your lowest temperature that your body reaches during sleep, which is why we can only record it immediately upon waking, before movement or even speaking, and after at least 5 hours of consecutive sleep.
This temperature shifts slightly in response to hormonal changes across your cycle.
Before ovulation, temperatures are lower, generally around 36-36.5°C. After ovulation, within the luteal phase, progesterone rises.
Progesterone is a thermogenic hormone that raises your core body temperature, and it is released after ovulation. If adequate levels of progesterone are released, your BBT will increase and should remain elevated (around 0.3–0.5°C) for about 10 days after ovulation (this is a general guide). After this, progesterone levels will either fall, along with your BBT, and your period will begin, or progesterone levels will continue to increase, along with your BBT, as a pregnancy has occurred.
Some people find that their temperature dips slightly before they ovulate, and also before they begin their period - tracking for at least 2-3 cycles is a great way to understand if this pattern shows up in your own cycle.
It’s important to know that BBT doesn’t predict ovulation — it only confirms that it has occurred, so if pregnancy isn’t your goal, then ensure adequate steps are still being taken in the lead-up to ovulation.
Remember that a woman’s fertile window, a period of time when she’s capable of conceiving, is generally considered to last for 6 days:
After ovulation, an egg is only viable for 12-16 hours
Sperm can survive for up to 5 days within a woman’s body, provided that conditions are optimal (remember that your body is doing its best to optimise for conception in the lead up to and just after ovulation).
So if you have unprotected sex 5 days before you actually ovulate, but have protected sex once ovulation has happened (which you have confirmed because we saw the temperature spike via BBT), there is still a chance you can fall pregnant.
Reading the Results
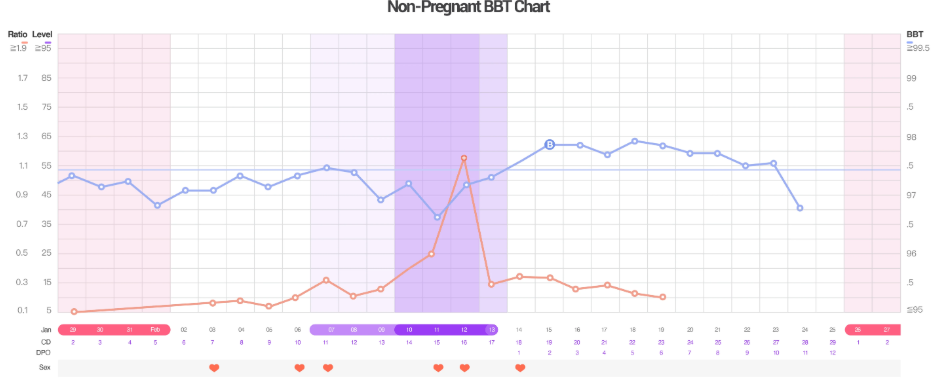
The blue line represents BBT, with the bolded blue point marking the first reading after ovulation has occurred. The first part of the chart, before this ovulation marker, is the follicular phase, while the latter part is the luteal phase. The final reading drops off, indicating the pregnancy hasn’t occurred and that a period is about to begin.
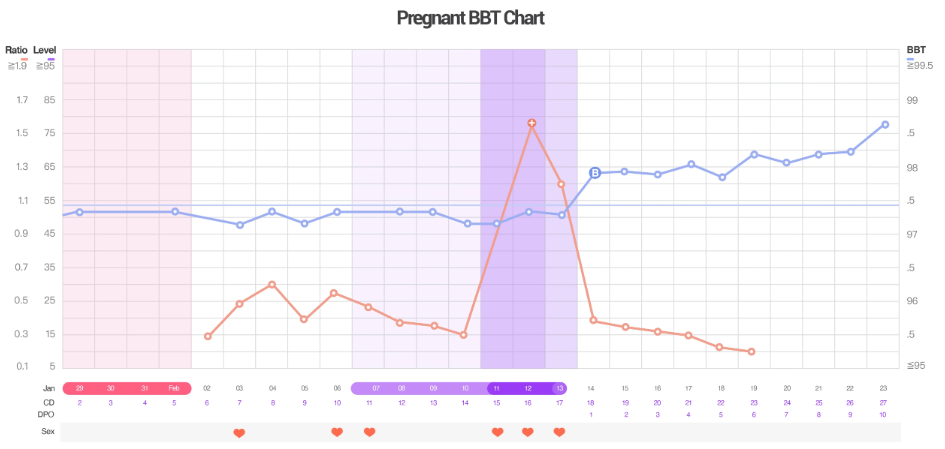
The blue line represents BBT, with the bolded blue point marking the first reading after ovulation has occurred. The first part of the chart, before this ovulation marker, is the follicular phase, while the latter part is the luteal phase. The final temperature reading spikes, indicating that a successful conception has happened, resulting in pregnancy.
Both chart examples were obtained from PreMom, BBT Chart: Pregnant vs Non-Pregnant, 2023 https://premom.in/bbt-chart-pregnant-vs-not-pregnant/
So to recap:
Before ovulation → temperatures are lower, generally around 36-36.5°C
After ovulation → progesterone rises → temperature increases around 0.2°C or more

What can we learn from BBT?
Tracking BBT can help to create a clear pattern over time of your hormonal patterns, and is a valuable tool to use for purposes outside of conception.
By recording each day’s temperature, we can gain the following insights:
Confirm that ovulation has occurred
Understand cycle length and patterns
Identify irregular or anovulatory cycles
Build awareness of hormonal shifts
Identify if pregnancy has occurred, or if a miscarriage has resulted (alongside other tests to confirm either outcome, such as a blood test or ultrasound)
Support fertility awareness (when used correctly)
Temperatures consistently below 36°C can suggest hypothyroidism
Post-ovulation temperatures that take a while to climb or dip during the luteal phase can indicate progesterone deficiency
How to Track BBT
Consistency matters more than perfection.
To begin:
Use a basal thermometer (these will include 2 decimal points, and are more sensitive than a standard thermometer). Keep the thermometer on your bedside within arm’s reach.
Take your temperature at the same time each morning
Measure before getting out of bed or checking your phone - literally as soon as you wake up. I recommend taking the temperature orally, by placing the thermometer under the tongue and holding until it lets you know that it has a reading.
Track daily over at least 2–3 cycles
Record each morning’s reading in an app or in a simple chart (like the one below)
Note:
Track alongside cervical mucus changes (e.g. creamy, stretchy, like egg-white, dry) and other symptoms (PMS, tender breasts, headaches, etc) to help establish clear patterns.
Note sleep quality, illness, or alcohol intake - write any of these factors down so we can understand what factors may be impacting your readings.
If you take your temperature earlier or later than usual, add it to your chart and make a note of the time it was taken. Be aware that it will be lower than usual if you woke up earlier and higher than usual if you woke up later, as your core temperature rises and falls with your circadian rhythms and body movements.
You can start charting on any day of your cycle, just make a note of how many days it’s been since day 1 of your last period, so we can estimate where in your cycle you are.
If you’re navigating irregular cycles, hormonal symptoms, or simply want deeper clarity, support can make this process feel far less overwhelming.
And if you choose to work with a naturopath, these tools can be integrated in a way that feels supportive, personalised, and aligned with your lifestyle — not restrictive or rigid.